
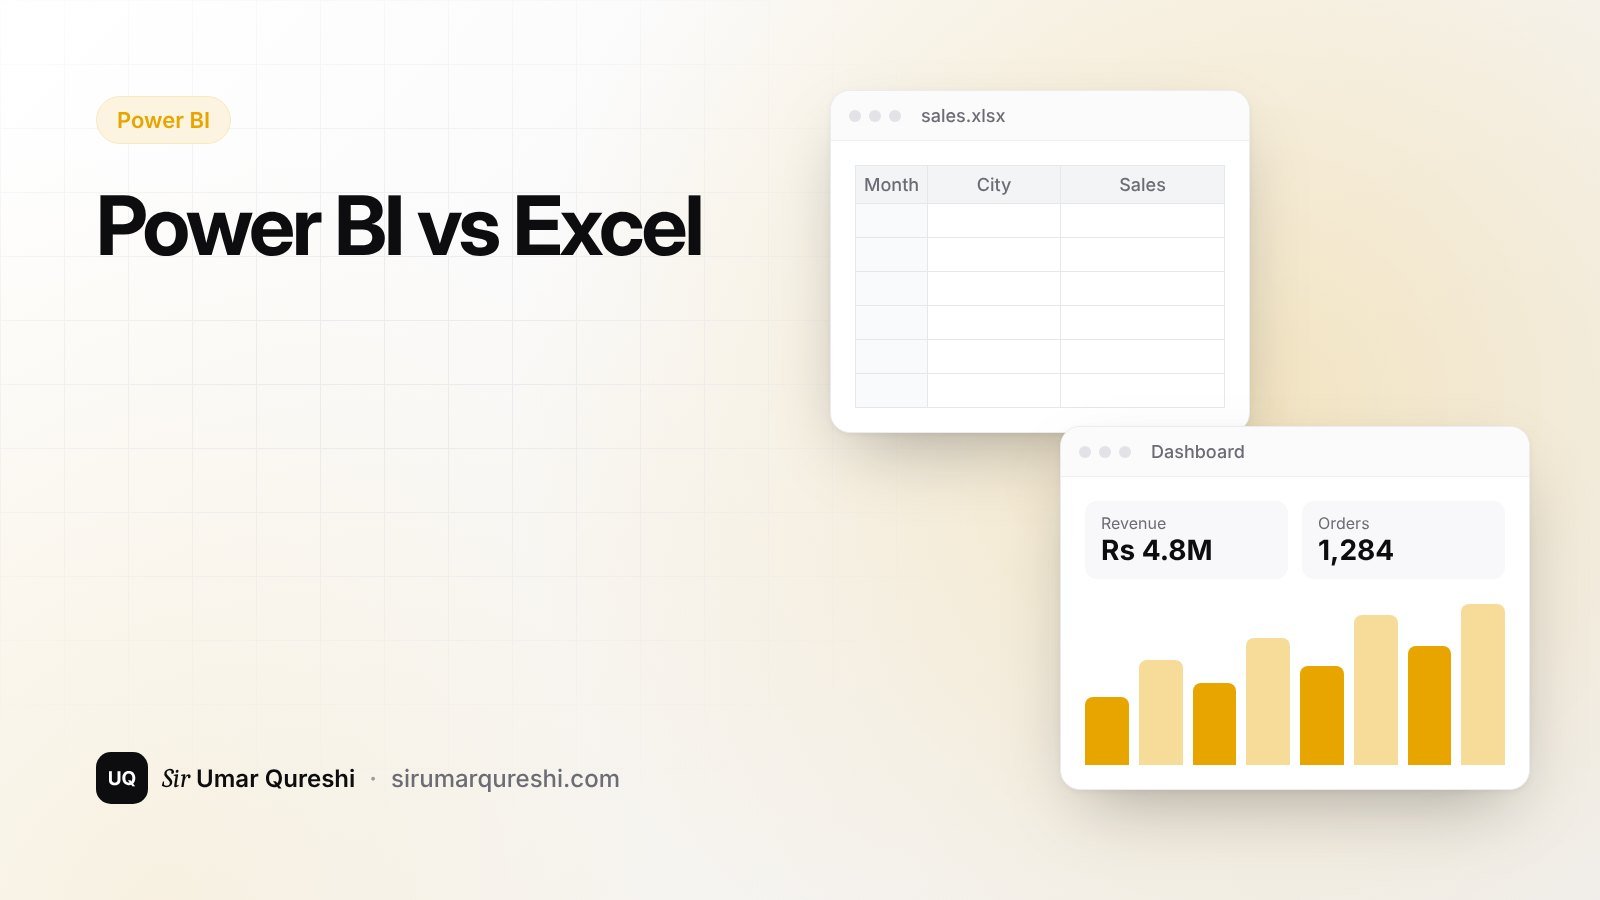
Learn Excel first, then Power BI. Excel is the everyday tool for calculating, organising and exploring data; Power BI is built for turning large or regularly updated data into interactive dashboards that many people view. Professionals use both — Excel for working with data, Power BI for sharing insights.
The key differences at a glance
| Excel | Power BI | |
|---|---|---|
| Main purpose | Calculations, analysis, ad-hoc work | Interactive dashboards & reporting |
| Data size | Comfortable with moderate data | Built for large data models |
| Data sources | Files, some connections | Many sources combined in one model |
| Refreshing | Mostly manual | Scheduled refresh (with the service) |
| Sharing | Send a file | Publish a report people open in a browser or app |
| Formulas | Cell formulas (SUMIF, XLOOKUP) | DAX measures |
| Learning curve | Easy start | Moderate — easier if you know Excel |
When Excel is the right tool
- Quick calculations, budgets, attendance sheets and invoices.
- One-off analysis where you need to try ideas fast.
- Data entry and cleaning before data goes anywhere else.
- Financial models with many what-if scenarios.
When Power BI is the right tool
- A sales or inventory dashboard that management checks every week.
- Combining data from several sources — for example Excel sheets, an online store and accounting software.
- Reports that must update automatically without someone copying data.
- Letting managers filter by month, city or product themselves.
A real example
Imagine a shop owner with daily sales in Excel. In Excel, they calculate this month's totals with SUMIFS and a pivot table. In Power BI, the same file becomes a dashboard: total sales, best-selling products, sales by city on a map, and a month-by-month trend — and next month it refreshes with the new data instead of being rebuilt.
The learning path I recommend
- Excel essentials: formulas, cleaning data, pivot tables, charts — start with 10 Excel formulas every job needs.
- Power Query (exists in both Excel and Power BI): clean and combine data without formulas.
- Power BI basics: loading data, relationships, visuals and filters.
- DAX: measures such as total sales, year-to-date and percentage change.
- Design & sharing: clean layouts, then publishing to the Power BI service.
💡 Tip: Power Query is the bridge: once you can clean data in Power Query, moving from Excel to Power BI feels natural.
Frequently asked questions
Is Power BI free?
Power BI Desktop for building reports is free to download. Sharing reports with others through the online service typically needs a paid licence — check Microsoft's current plans.
Can Power BI replace Excel?
No. They complement each other. Most analysts do their thinking in Excel and their reporting in Power BI.
How long does it take to learn Power BI?
If you already know Excel, you can build useful dashboards within a few weeks of regular practice; mastering DAX and data modelling takes longer.
Learn both with hands-on projects in my Power BI & data analytics training.